
Author: Erica Streat (Emprise)
As we advance our goal of becoming a more data-driven organization (fig. 1), we have adopted an application that has transformed the way we understand and interact with our data: Tableau.
Using Tableau, subject matter experts and stakeholders can utilize data visualization to identify trends, patterns, and outliers in data. Data visualization can provide ways to analyze large amounts of information, track key performance indicators (KPIs), and make data-driven decisions based on measurable outcomes.
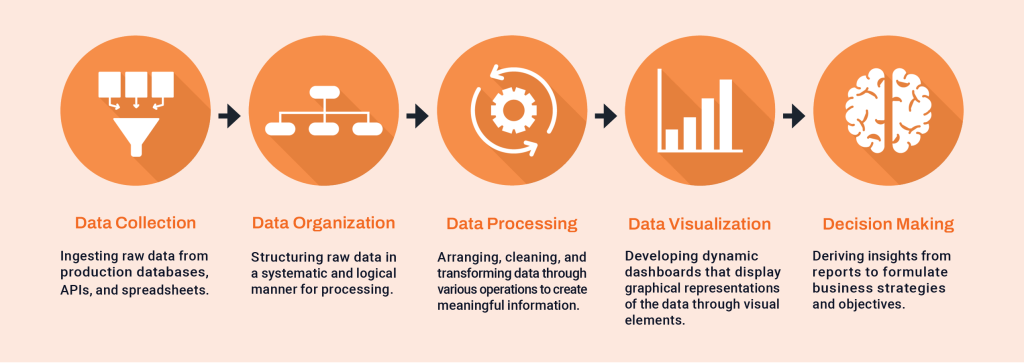
Tableau is a powerful visualization tool that turns complex data into easily understandable formats. It helps us share insights about our operations through focused, dynamic dashboards. Tableau stands out by offering ease of use with its intuitive interface. It allows users to interact with visualizations and drill down into the data most relevant to them.
Tableau seamlessly integrates with a variety of data sources, from spreadsheets to databases, allowing a unified view of information gathered from multiple origins. By converting raw data into visually appealing formats, such as charts, graphs, and interactive dashboards, Tableau makes it possible for individuals at all levels to make data driven decisions based on patterns, trends, and relationships within the data.
These dashboards represent a glimpse of the visualizations powering our business intelligence efforts at MSC N7. Our goal is to empower you with the foundational knowledge to leverage Tableau in your strategic planning.